Establishing Basecamp
Theme 1’s objective of conceptualising and describing the changing demand for energy within UK society is easy to say, seductively straightforward to write and, it seems, fiendishly challenging to achieve. To make progress we have tried initially to establish some basic principles:
1. Energy demand is an emergent outcome of what people do and ‘what people do’ is seen as a nexus of the social practices in which they are engaged, the time at which they are enacted and the place(s) in which they performed.
2. Variation and change in energy demand must therefore relate to:
- Variation and change in the performance of social practices that directly or indirectly require energy;
- Variation and change in the temporal and spatial distributions of these performances;
- Variation and change in both the ‘energy’ and ‘carbon intensity’ of these performances.
It follows from these principles that understanding energy demand depends, above all, on understanding the timing and location of a range of interconnected social practices.
Thus we need to combine data on the sequencing, synchronisation, timing, location and performance of a range of social practices and we need to do this across the UK population and over time. In addition, if we want to make the step from social practices to energy itself then we need to find a way to assign ‘energy/carbon intensity’ to the various performances of the practices of interest so that future ‘scenario modelling’ of changing performances and/or prevalences of social practices can have worked-through ‘energy/carbon implications’.
Scouting the terrain
And here is our curiously tricky problem: our review of existing data on the temporal and spatial performance of social practices as captured through, for example, time-use surveys and the national travel survey has shown it’s extremely patchy and partial nature. Whilst we have society-wide time-use data back to the 1960s, the most recent comprehensive study in the UK was in 2000/1 with a simpler study conducted in 2005 (a new comprehensive time use survey for Britain will take place in 2014-15). Since 2005 we have nothing but a small-scale and experimental urban study combining a time-use survey with limited GPS tracking. Even then, and for reasons that are themselves intriguing, the types of data that have been collected reflect contrasting methodological, political and practical imperatives that have frequently meant that what we really want to know was either not asked, intentionally excluded or somehow obfuscated in the data collection, coding or archival processes.
Similarly, a review of approaches to the measurement of even just domestic energy consumption has shown that linkage of measured energy consumption to what people actually do in the home is extremely rare[1]. There are, for example, a number of datasets which have measured minute by minute electricity consumption in a number of households over periods of months and even years. As with the time use and travel surveys, since untangling the relationship between what people do and their energy consumption was not the aim of the study, we have very little idea of what generates that measured consumption. We’ve tried to summarise some of these emerging themes in the table below and are currently writing a paper based on these reviews following presentation at a conference in September[2] and also at a policy seminar with DECC on 12th December 2013.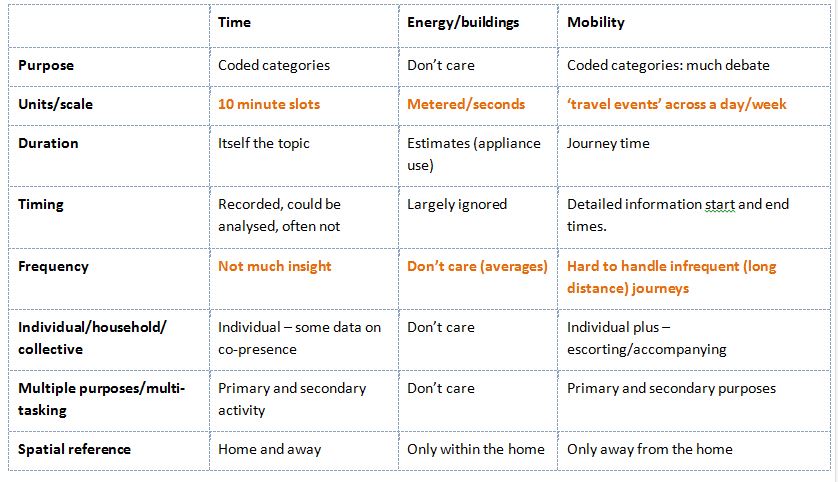
Establishing boundaries
Undaunted by these data difficulties we have sallied forth to try to characterise first the variation and secondly the change (and change in variation) of social practices that are of substantive interest. But which practices to focus on? Fairly straightforwardly we have chosen to focus on those that either are now or are forecast to be the main ‘energy demanders’. In the main these practices are also relevant to the needs of other DEMAND themes so that our analysis can feed forward into the wider effort of the Centre. Where they may differ we are nevertheless confident that we are developing analytic approaches which can easily be applied to other substantive topics across DEMAND.
Thus, since around 66% of household energy consumption is thought to derive from space heating, 16% due to water heating and 15% due to lighting and appliances[3] a focus on the social practices that generate or require a heated home, that involve hot water, that involve lighting and that involve (especially media) appliance use would seem sensible. So too of course must be a focus on practices related to mobility since personal travel has recently been estimated to account for c 20% of an average household’s total carbon footprint[4].
Initial skirmishes: mapping variation
With these decisions taken we are now in a position to initiate exploratory studies and these are starting to uncover some of the variation in locations, timings and performances of the practices of interest in the most contemporary datasets we can find. Initial results include analysis of the location given by time use diary respondents through the day, over the week and in different seasons; analysis of the timing of different kinds of travel including the development of a kind of societal synchronisation index; analysis of various kinds of home activities (especially cooking, eating and dishwashing to illustrate sequences); analysis of EDF’s combined time-use and energy measurement studies[5], and exploratory work on a sub-sample of the ‘Oxford/Trajectory’ 2012 Time Use and GPS tracking data. Taking a different, ‘ground-up’ approach we have also attempted similar analyses of minute by minute electricity consumption data from a sample of 22 Loughborough households. More recently ee have been exploring the possibility of using novel ways to cluster and visualise sequences of activities (practices?) using software developed at the Linkoping University Institute of Technology. Indeed the developer of the software Katerina Vrotsou, is hoping to collaborate with DEMAND through a research visit to Britain sometime in 2014.
The results of these analyses were discussed in some depth at a recent 2-day Theme 1 meeting at the Devil’s Punchbowl in Surrey and synthesised into a condensed presentation given to DECC on the 10th December.
One of the most interesting issues to emerge from these preliminary analysis has been the extent to which the synchronisation of social practices produces ‘peaks’ or hotspots which can have implications for energy demand. This is most clearly seen when considering peaks of electricity demand for ‘switchable’ appliances – such as 07:00-09:00 and 16:30-19:00 during weekdays which is a key focus of a number of ‘demand response’ activities. However it’s also worth thinking about other implications of ‘peak’ – for example peak travel at commute times has positive carbon/energy implications as it enables the effective provision of public transport to shift the maximum number of people with the minimum energy resource. Similarly synchronised occupancy is to be welcomed in the provision of neighbourhood heating supplies.
It is also useful to think about the nature of synchronisation as a property emerging from the interactions of societal and institutional structures (e.g. working & school hours) with individual and family habituation. As the social practices approach constantly reminds us, there is very little ‘active choice’ in societal synchronisation. As a result of their situation within household and institutional contexts, the ability of individuals to shift the timing and location of their performances of social practices (whether towards or away from ‘peak’) is both unclear and also quite likely to be over-estimated by an atomic individual utility based analysis.
Over the horizon
Whilst we are now working to pull some of these analyses together into articles we have also taken a few peeks over the horizon to start to think about change over time. Our data resource for this work is likely to include the historical multinational time-use survey (MTUS) dataset from the University of Oxford, bolstered by access to their recent time-use survey/GPS tracking (‘Trajectory’) study data. With regard to mobility, we are thinking about innovative ways of analysing data from the National Travel Survey (NTS) – carried out since 1965/66 and turned into a continuous survey in 1988 (data for the years 2011-12 are expected to be made public in February 2014). This will give coverage of the UK from at least the 1970s up to the early 2010s and should enable the analysis of the evolving nature of practices over time in the UK and beyond.
Finally with respect to connections with other DEMAND themes our data review has suggested a number of potential avenues:
- Theme 2
- Domestic ICT Use – this is relatively well captured if in rather broad terms by the time-use surveys of 2000/1 and 2005 as well as by a bespoke ICT & internet longitudinal panel in the late 1990s which may provide a historical context to contemporary usage patterns. Theme 1 contact: Ben
- Business Travel – although we have identified a number of issues with the way ‘business travel’ is coded in the national travel survey, again both the time-diary and national travel survey data should provide a useful contextual resource as will the ‘Trajectory’ GPS-tracking data. Theme 1 contact: Jillian (Jacopo for GPS data)
- Older people’s mobile lives – as hinted above time use surveys can provide contextual information on current and historical practices of mobility for older people with the national travel survey non-diary element also enabling analysis of more infrequent trips such as holidays. Theme 1 contact: Jillian
- Theme 3
- Infrastructures for Online shopping – perhaps surprisingly, patterns of online shopping are actually extremely well captured by the ONS 2000/1 time-use survey as it drew distinctions between online and ‘physical’ shopping (and different kinds of shopping – food vs clothing etc) as well as between other ‘online’ and physical household management activities. That said only 33% of the households sampled had internet access at that time so the data might be slightly sparse. Alternatively the 2005 time-use data provides information on when online shopping took place but does not distinguish between different kinds of shopping. Theme 1 contact: Ben
Footnotes
[1] For an exception see Ellegård, K., Vrotsou, K., & Widén, J. (2010). VISUAL-TimePAcTS/energy use – a software application for visualizing energy use from activities performed. Conference proceedings 3rd International Scientific Conference on “Energy Systems with IT”. Stockholm; Widén, J., Lundh, M., Vassileva, I., Dahlquist, E., Ellegård, K., & Wäckelgård, E. (2009). Constructing load profiles for household electricity and hot water from time-use data – Modelling approach and validation. Energy and Building , 41, 753-768; Ellegård, K., & Palm, J. (2011). Visualizing energy consumption activities as a tool for making everyday life more sustainable. Applied Energy , 88, 1920-1926.
[2] Anable, J., Anderson, B., Shove, E., & Torriti, J. (2013) Theories Categories & Units: collecting and using data on time, mobility and energy demand. Paper presented at ‘Modelling on the move” Social theory, transport and energy modelling workshop organised by Rachel Aldred, University of Westminster, 13th September 2013.
[3] DECC (2013) Energy Efficiency Strategy, 2013 Update.
[4] Druckman, A., Jackson, T., 2010. An exploration into the carbon footprint of UK households. RESOLVE Working Paper Series 02–10. University of Surrey, Guildford, UK. November 2010.
[5] See also Durand-Daubin, M. (2013) Household activities through various lenses: crossing surveys, diaries and electric consumption. 2013 Conference Proceedings, Behavior, Energy and Climate Change Conference, The Berkeley Institute of the Environment, UC Berkeley.